TRADING & INVESTING STRATEGIES
Online Course
REGISTER NOW
5-year performance of the 50 nifty stocks
Posted: May 4, 2021 02:00
SHARE
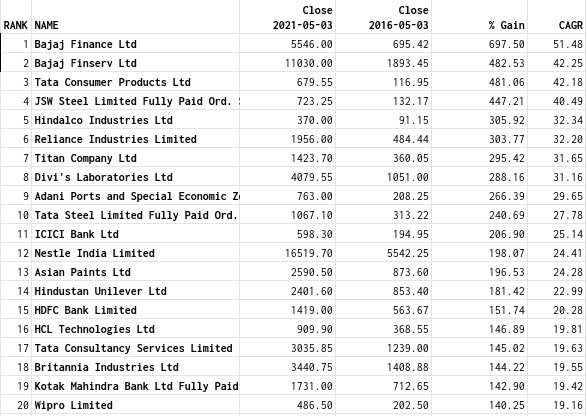
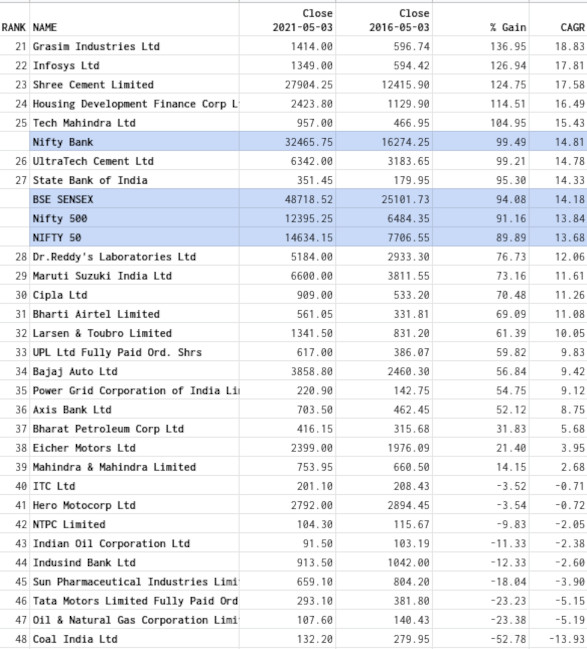
The tables below show the gains made by the current 50 nifty stocks over the last five years (3 May 2016 to 3 May 2021). The stocks are arranged by their performance rank, and the sensex, nifty, nifty 500 and the bank nifty also included to show how they compared with stocks.
The first table shows the top 20 performers, and the second the bottom 30. The four indices all fell in the second table.
The CAGR (Compound Annual Growth Rate) is also shown. The CAGR is the "interest rate" which if compounded annually would take the stock from its starting price to the final one.
The table below was created in minutes using Google Sheets and its powerful GOOGLEFINANCE() function. This function is used extensively in our course, and is one of many subjects which you will learn there:
Online Course: Trading and Investing Strategies : Course details
TOP 20
BOTTOM 30
More stories about:
India
Investing
Markets
News