TRADING & INVESTING STRATEGIES
Online Course
REGISTER NOW
Which of these indices has provided the highest returns over the years?
Posted: Jul 28, 2021 01:50
SHARE
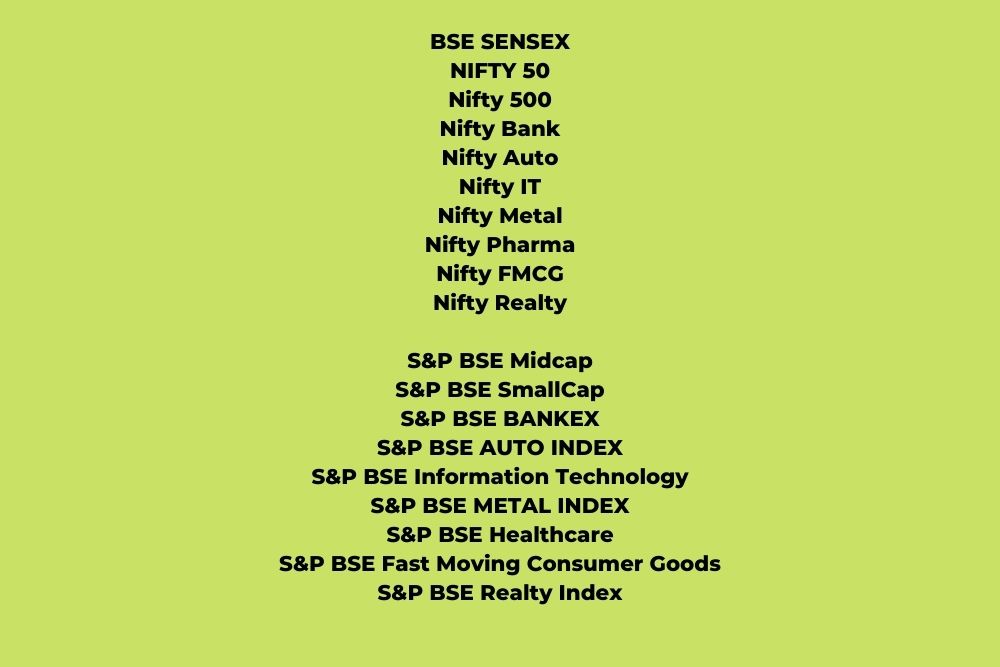
These are the returns for the sensex, nifty and various sectoral indices on the BSE and NSE over the years. CAGRs are given in the brackets that follow the returns. Some of the indices are more recent than the others, and have not been shown if they did not exist.
Returns are up to 30 June, 2021.
One-year returns (from 30 June, 2020)
BSE SENSEX: 50.31%
NIFTY 50: 52.60%
Nifty 500: 58.98%
Nifty Bank: 62.71%
Nifty Auto: 57.76%
Nifty IT: 97.69%
Nifty Metal: 161.92%
Nifty Pharma: 43.30%
Nifty FMCG: 20.06%
Nifty Realty: 69.73%
S&P BSE Midcap: 72.62%
S&P BSE SmallCap: 103.80%
S&P BSE BANKEX: 61.98%
S&P BSE AUTO INDEX: 55.62%
S&P BSE Information Technology: 102.43%
S&P BSE METAL INDEX: 158.87%
S&P BSE Healthcare: 57.35%
S&P BSE Fast Moving Consumer Goods: 20.07%
S&P BSE Realty Index: 73.30%
3-year returns (from 30 June, 2018)
BSE SENSEX: 48.83% (14.17%)
NIFTY 50: 47.52% (13.84%)
Nifty 500: 47.91% (13.94%)
Nifty Bank: 32.57% (9.85%)
Nifty Auto: -0.61% (-0.20%)
Nifty IT: 107.27% (27.50%)
Nifty Metal: 54.38% (15.57%)
Nifty Pharma: 56.66% (16.14%)
Nifty FMCG: 25.42% (7.84%)
Nifty Realty: 28.41% (8.69%)
S&P BSE Midcap: 46.95% (13.69%)
S&P BSE SmallCap: 58.49% (16.59%)
S&P BSE BANKEX: 34.85% (10.48%)
S&P BSE AUTO INDEX: -0.01% (0.00%)
S&P BSE Information Technology: 114.60% (28.99%)
S&P BSE METAL INDEX: 45.48% (13.31%)
S&P BSE Healthcare: 83.29% (22.38%)
S&P BSE Fast Moving Consumer Goods: 21.34% (6.66%)
S&P BSE Realty Index: 33.92% (10.22%)
10-year returns (from 30 June, 2011)
BSE SENSEX: 178.48% (10.78%)
NIFTY 50: 178.38% (10.78%)
Nifty 500: 197.89% (11.53%)
Nifty Bank: 209.23% (11.95%)
Nifty IT: 340.29% (15.98%)
Nifty Pharma: 197.05% (11.50%)
Nifty FMCG: 248.09% (13.28%)
Nifty Realty: 28.51% (2.54%)
S&P BSE Midcap: 228.80% (12.64%)
S&P BSE SmallCap: 209.35% (11.96%)
S&P BSE BANKEX: 206.92% (11.87%)
S&P BSE AUTO INDEX: 170.18% (10.45%)
S&P BSE Information Technology: 394.01% (17.32%)
S&P BSE METAL INDEX: 23.92% (2.17%)
S&P BSE Healthcare: 299.96% (14.87%)
S&P BSE Fast Moving Consumer Goods: 234.15% (12.82%)
S&P BSE Realty Index: 35.69% (3.10%)
20-year returns (from 30 June, 2001)
BSE SENSEX: 1431.88% (14.62%)
NIFTY 50: 1328.25% (14.22%)
S&P BSE BANKEX: 3048.00% (18.82%)
S&P BSE AUTO INDEX: 4116.27% (20.57%)
S&P BSE Information Technology: 1983.25% (16.40%)
S&P BSE METAL INDEX: 1386.11% (14.45%)
S&P BSE Healthcare: 2165.92% (16.89%)
S&P BSE Fast Moving Consumer Goods: 1385.08% (14.44%)
These tables were created in minutes using Google Sheets and its powerful GOOGLEFINANCE() function. This function is used extensively in our course, and is one of many subjects which you will learn. At the end of the course you will have your own large toolkit of Sheets which compute Risk & Money Management, Momentum Investing, Day-trading set-ups, several technical analysis indicators and many more!
Online Course: Trading and Investing Strategies : Course details
More stories about:
Markets
News