TRADING & INVESTING STRATEGIES
Online Course
REGISTER NOW
35 years of sensex daily closings analysed
Posted: Mar 17, 2021 20:48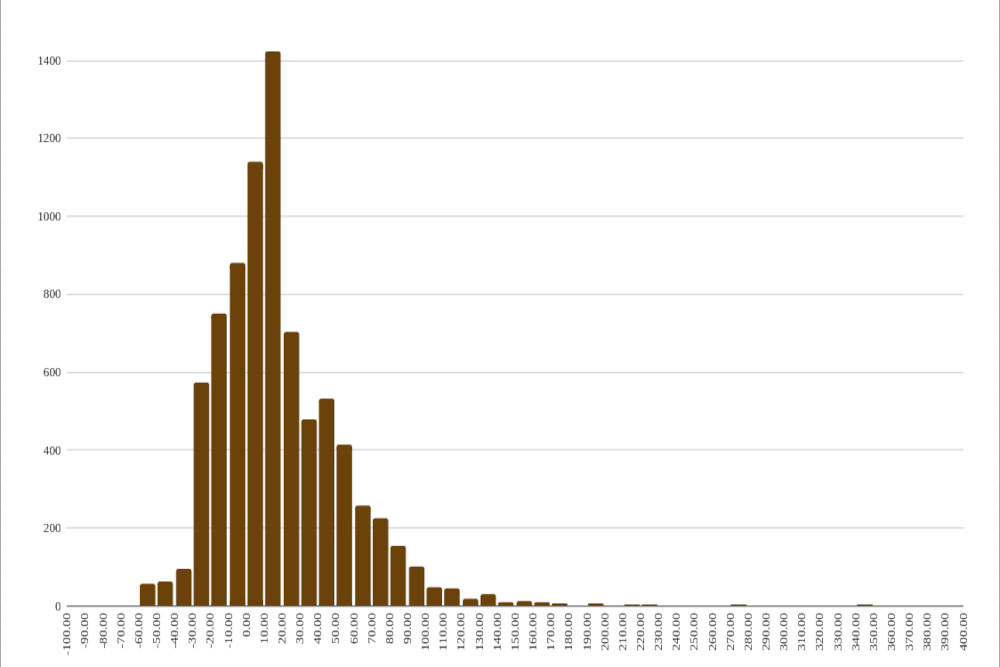
SHARE
The sensex was published on January 1, 1986 (Wikipedia), and back-calculated index values from 1979 were also released with it.
For this study we will take figures only from 1986, as there would be a recency bias in the choice of stocks in the index.
(You can click on all the underlined terms in this piece to get more information on what they mean).
Daily data from Jan 2, 1986 (the first trading day that year) to Mar 16, 2021 has been taken, giving us 8,330 trading days.
The average daily YOY (Year-Over-Year) returns for the sensex between these dates is 16.77%. Computation starts from Jan 2, 1987 - which is one year from the start of the data.
The sensex was 549.43 on Jan 2, 1986, and 50,363.96 on Mar 16, 2021, giving it a CAGR (Compound Annual Growth Rate) of 13.69% over 35 years and 75 days.
The highest YOY return was 266.9% between Mar 27, 1991 and Mar 31, 1992. The worst YOY return was -56.5% betweem Jan 11, 2008 and Jan 13, 2009.
We have 8,133 trading days for which the YOY returns were computed. Of these 5,544 (68.2%) days gave positive returns, and 2,589 (31.8%) gave negative (or zero) returns. The standard deviation of these returns is 33.4%. The YOY return on Mar 16, 2021 stood at 60.45%.
Apart from all the YOY statistics, the daily return data is also interesting. This computation starts from 1986 itself, as we do not have to wait a year for the YOY returns.
The average daily return for the sensex from Jan 3, 1986 to Mar 16, 2021 is +0.0679%. That is the arithmetic mean (AM). The Geometric Mean (GM) is +0.0543%. The GM is always less than the AM, unless all data points are identical, in which case they are the same.
When compounding returns, we must use the GM and not the AM. For instance, you can actually use the GM to get the Mar 16, 2021 closing from the Jan 2, 1986 one :
50363.96 = 549.43 * (1.000543) ^ 8329
50363.96 is the sensex's Mar 16, 2021 closing, 549.43 is that on Jan 2, 1986, 1.000543 is (1 + GM) for getting the multiplier for a single day. The operator ^ is "to the power of", and 8329 is the number of days of data. (You will need a few more decimal places in the GM to get the precise value).
The standard deviation of the daily returns is 1.6506%. The range between the average daily return plus and minus three standard deviations is -4.88% and 5.02%. If this were a Normal Distribution then we would expect 99.73% of the daily returns to be inside those two percentages. This would mean that we should not find more than 23 days where the sensex fell more than 4.88% or gained over 5.02%. However, there are 129 such points, the reason such distributions are said to have fat tails.
The largest single day gain was 20% on Mar 2, 1992 (12 standard deviations). There are five single day gains in excess of 10%.
The largest single day loss was 13.2% on Mar 23, 2020 (8 standard deviations). There are four single day losses in excess of 10%.
Course & Anticourse
Statistical analysis such as that above provides us with reliable insights about the market, and is aeasier than than it looks. It is one of several tools used in Course & Anticourse.
Registrations now for our Trading and Investing Course, in which you will learn several Investing and Trading Strategies that have been proven to outperform the market for years.
DetailsMore stories about:
Investing
Markets
Blog