TRADING & INVESTING STRATEGIES
Online Course
REGISTER NOW
Technical Analysis : You need just one chart pattern!
Posted: May 26, 2025 17:00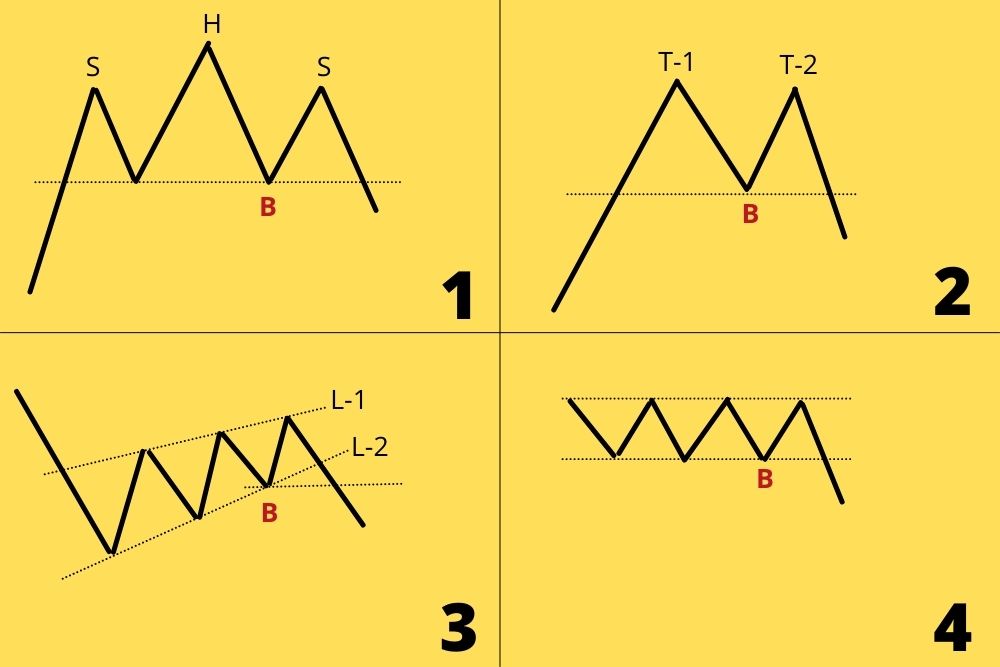
SHARE
Though there are literally hundreds of Technical Analysis indicators, it is chart patterns that are the hallmark of Technical Analysis. In fact, technical analysts are most often referred to as chartists.
Books provide fairly detailed descriptions of chart patterns, very often by way of long stories about what is going on behind the scenes as chart patterns form. In fact, the 1948 classic Technical Analysis of Stock Trends by Robert D. Edwards and John Magee has nearly 600 pages describing chart patterns, with absorbing stories about the companies whose charts are provided as examples.
In the image above we see four different chart patterns. They are (1) Heads and Shoulders, (2) Double Top, (3) Wedge and (4) a sideways range which could be one of several patterns.
In each of these we have shown a sell signal, which occurs when the price goes below the dotted line. When that happens, chartists would square off their existing long trading positions, go short, or do both.
However, though these are stand-alone chart patterns which find their own unique descriptions in text books, they have one thing in common. With the exception of (3) the sell signal coincides with the price falling below the previous bottom (B). Even in the case of (3), we could simply wait for the price to go below B, as that could well turn out to be a support point.
So, all we have to do to replace all these chart patterns is to simply mark out tops and bottoms in a price chart, as done below. An uptrend will always have rising tops and bottoms, and a downtrend falling tops and bottoms.
When the price goes below a previous bottom (B-3), you get a downtrend and a sell signal, while a move above a previous top (T-6) results in an uptrend and a buy signal.
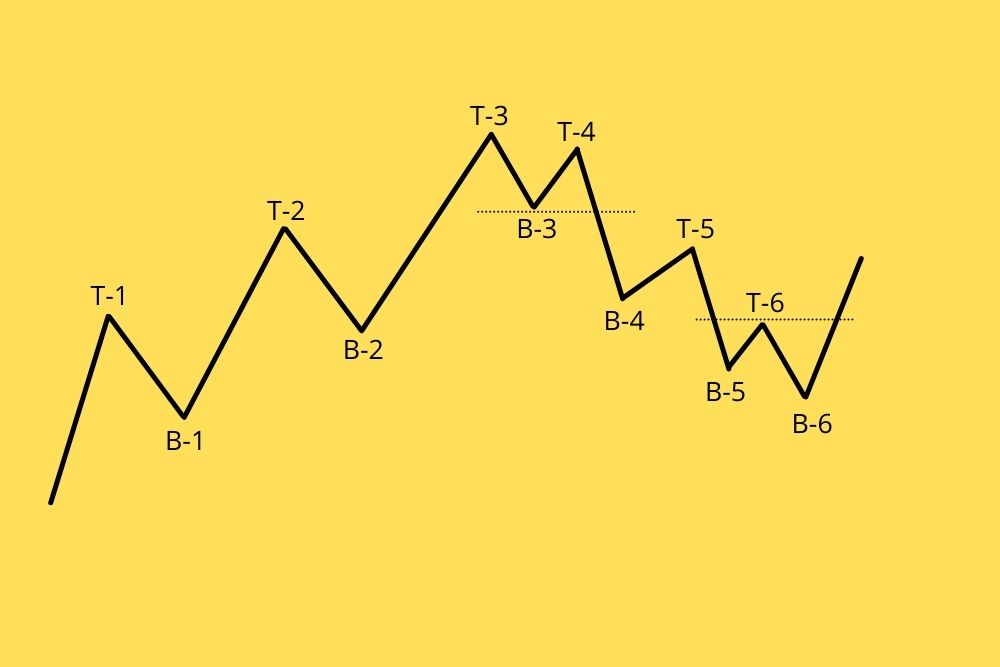
Note that it is mathematically necessary for an uptrend to have rising tops and bottoms, and downtrends to have falling ones! Sideways moves will have the tops and bottoms at roughly the same levels as the preceding ones.
Technical Analysis is not scientific, and there are no guidelines to check any of its many processes. As a result, it is full of assertions, and it is up to you to use indicators and chart patterns as you please. These will always provide the occasional profitable trades as the market is random, and this leads many traders to believe they are winning.
Technical Analysis is also full of a lot of redundant material and stories as in the case of chart patterns. This guarantees its popularity in mainstream and social media, without too much concern for its effectiveness.
However, very few traders actually monitor their performance correctly, and see if they are doing better than a simple long-term buy and hold strategy. Even if they are, even fewer will analyse whether the risk they take is worth the returns they get.
Technical analysis is just one of many subjects covered in our Trading and Investing Strategies online course. The course is evidence-based, using academic research as the most reliable source for understanding what actually works in markets.
Read more about the course here.
More stories about:
Markets
Trading
Blog