TRADING & INVESTING STRATEGIES
Online Course
REGISTER NOW
The unexpected "indicator" that caught the October 2008 and March 2020 major market bottoms
Posted: May 27, 2025 19:37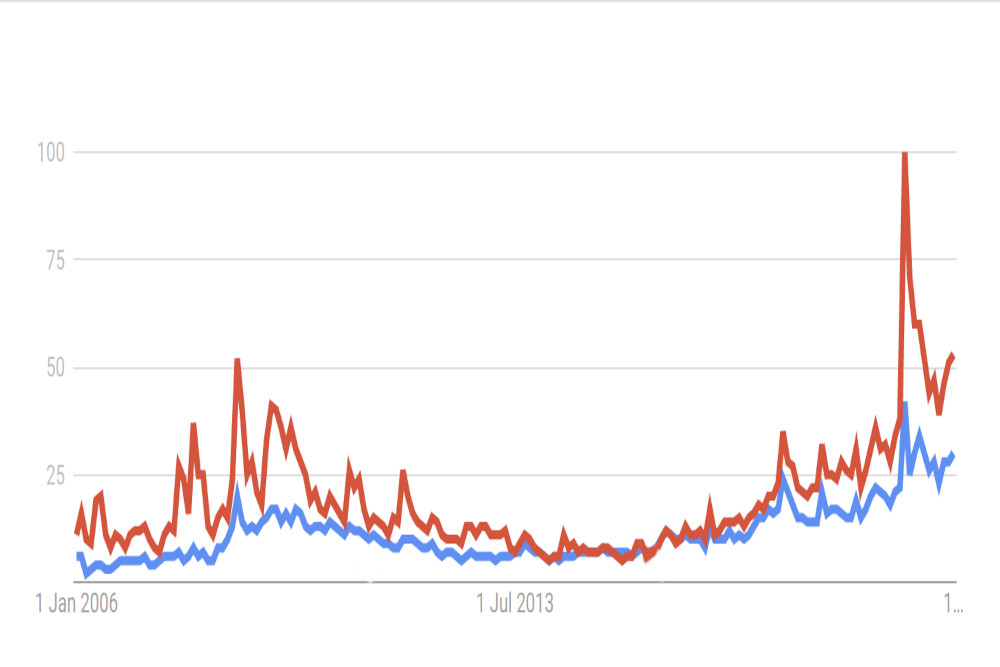
SHARE
This chart shows the total number of searches per month on the Sensex (red) and Nifty (blue) from 2006 to 2020. The two highest peaks (readings of 50 and 100) occurred in October 2008 and March 2020—the very months when major bear markets bottomed out and led to immediate, powerful upward moves.
Why Google Search Data Works as a Market Indicator
The logic is surprisingly straightforward: people search for subjects that trouble or excite them. During market extremes, search activity spikes as investors desperately seek information, explanations, or reassurance. This creates measurable peaks in search volume that often coincide with market turning points.
In October 2008, as global markets crashed following the Lehman Brothers collapse, Indian investors frantically searched for "Sensex" and "Nifty" as they watched their portfolios evaporate. Similarly, in March 2020, the sudden pandemic-driven crash sent search volumes soaring just as markets hit their lows.
The Behavioural Finance Connection
This phenomenon illustrates a key principle from behavioural finance: extreme emotions often signal market reversals. When fear peaks (high search activity during crashes), it often marks capitulation—the point where most sellers have already sold, creating conditions for recovery.
Conversely, periods of low search activity might suggest complacency, potentially signalling market tops when investors become overconfident and stop seeking information.
Practical Limitations and Broader Applications
Whilst these two events alone aren't sufficient for a regular trading strategy, this approach opens exciting possibilities for creative analysis. You could monitor search trends for specific stocks before earnings announcements, track sector-specific search spikes, or combine search data with other technical indicators for better timing.
A Growing Field of Research
This represents just one example of quantitative behavioural finance—a field that combines human psychology with measurable data. Academic researchers are increasingly exploring how investor sentiment, reflected in search patterns, social media activity, and news flow, can provide market insights that traditional analysis misses.
Such approaches complement classical market anomalies like momentum investing (buying recent winners) and value investing (buying underpriced stocks), both of which have decades of academic support behind them.
Interesting Observation
One additional insight from the chart: Indians search for "Sensex" far more than "Nifty", despite traders on social media focusing heavily on Nifty and Bank Nifty futures. This suggests retail investor attention remains anchored to the older, more familiar index.
For those interested in exploring these concepts further, along with proven strategies backed by academic research, Deepak Mohoni's Trading and Investing Strategies online course covers quantitative behavioural finance alongside momentum investing, risk management, and other evidence-based approaches. The course includes practical Google Sheets tools and direct access to Deepak for personalised guidance.
More stories about:
Investing
Markets
Psychology
Technology
Trading
Blog